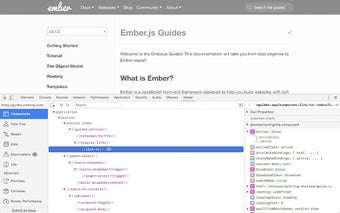
Ember Inspector: A Powerful Tool for Debugging Ember Applications
The Ember Inspector is a Chrome plug-in developed by ember-extension-admins that provides a comprehensive set of debugging tools for Ember.js applications. This free tool integrates seamlessly with the Chrome developer tools, making it easy to understand and debug your Ember.js application.
With the Ember Inspector, you can effortlessly view all the routes defined in your application and reference Ember's naming conventions for URLs, including the recommended naming for controllers, templates, and routes. Additionally, you can overlay your application with information about the currently rendered templates, controllers, and models.
One of the standout features of the Ember Inspector is its ability to inspect objects in your application, such as models and controllers. The user interface fully supports Ember features like bindings and computed properties, allowing you to navigate and understand your application's data structure. Furthermore, the Inspector makes your application's objects available in the console as the $E variable, providing a convenient way to interact with them.
For developers using Ember Data, the Ember Inspector offers a valuable feature to see all the records that have been loaded. This can be immensely helpful in tracking data flow and identifying potential issues.